Monitoring#
This guide explains how to monitor your virtual machines (VMs) in the myDelska Dashboard and set alerts for CPU, RAM, disk, and network metrics.
What is Monitoring in the Dashboard used for?#
Monitoring notifies you of problems or warnings about CPU load, low disk space, or network traffic. You receive notifications on the channel of your choice, so you can keep track of your instance’s health without watching it manually.
How to set an alert in the Monitoring section#
To set an alert, follow the steps below:
- In the Dashboard, choose Monitoring.
- Click the New alert button and select the parameter to monitor.
- Enter a Name and configure at which values the alert should notify you.
- Set the threshold value — a percentage for CPU/RAM/SSD, or Gbps and kpps for network traffic.
- Choose the notification type: Send an Email, Send SMS, Connect your Slack, or Send notification to all workspace members.
- Click Create.
- In the created alert, specify the instance (VM) to monitor.
- Click Save.
Example — CPU load above 70% for 5 minutes, with all notification types enabled:
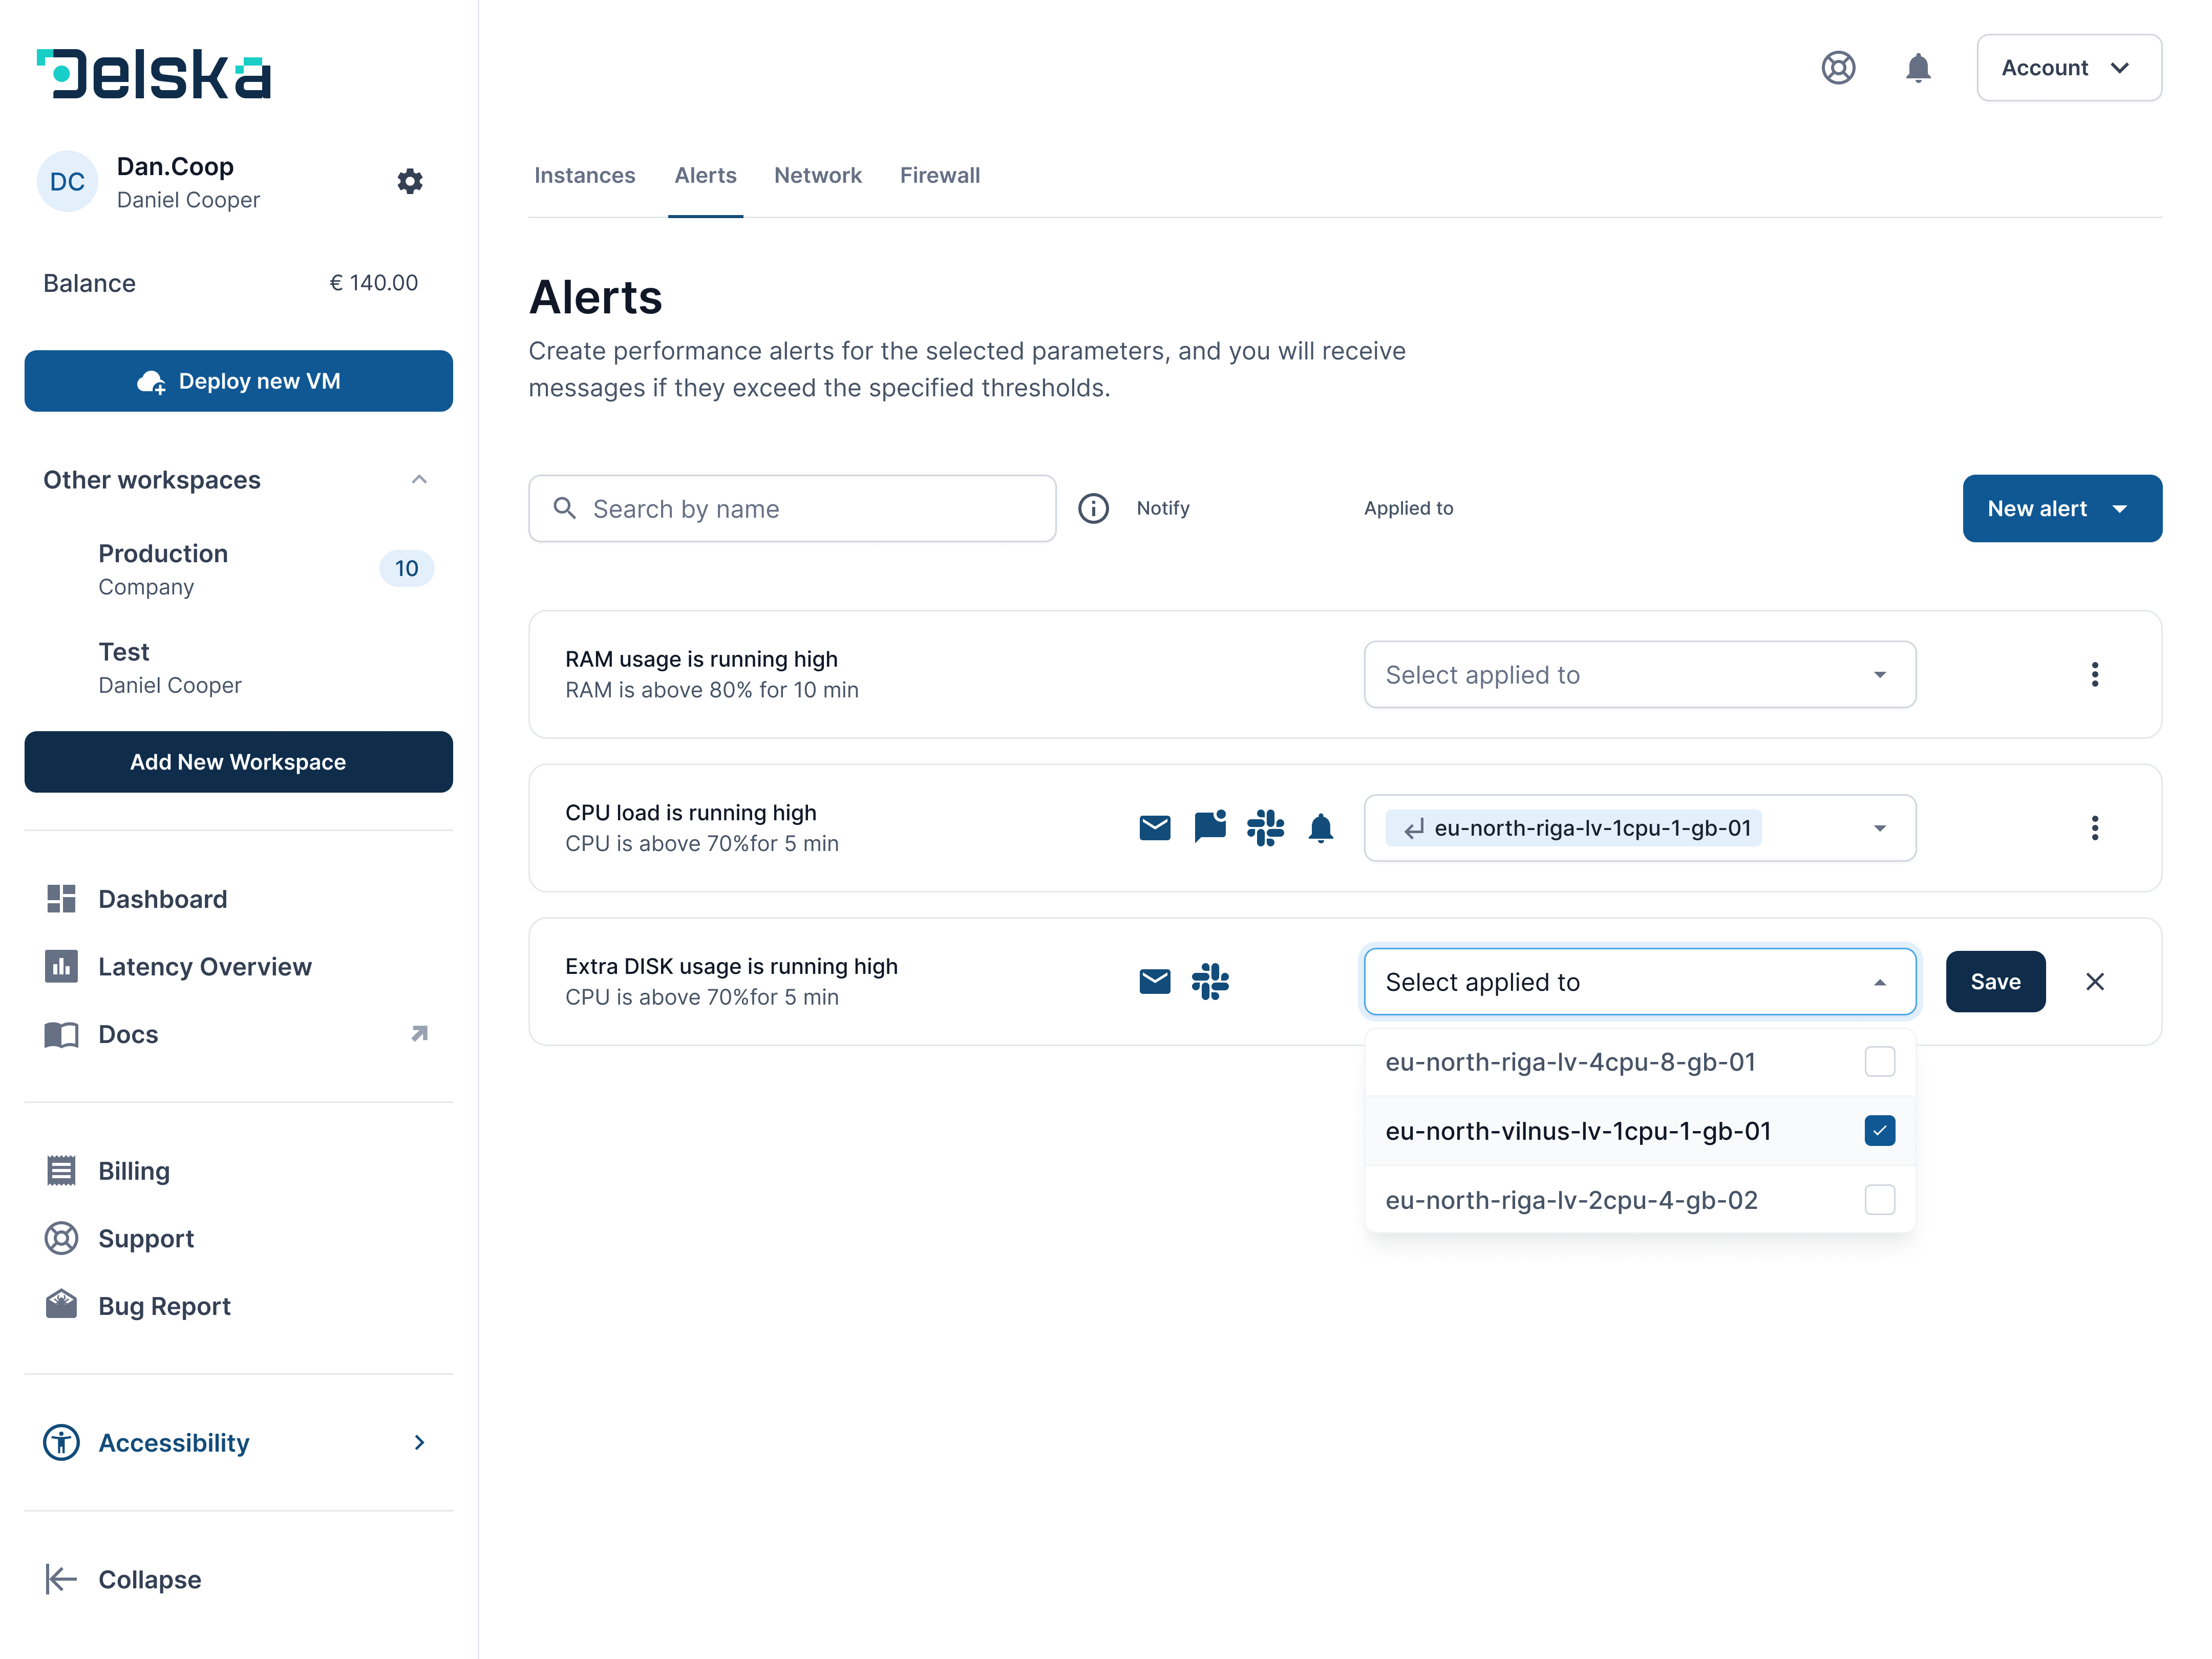
Open Monitoring in myDelska to create your first alert.
What monitoring metrics can be tracked?#
You can set alerts and view metrics for the following VM parameters:
- CPU % — average CPU utilization, as a percentage.
- RAM usage — RAM utilization, as a percentage.
- Disk usage — how much space is used on the main and extra disks.
- Network bandwidth — incoming or outgoing traffic (Gbps) passing through the VM network interfaces.
- Network packets per second — incoming or outgoing packet rate (kpps) on the VM network interfaces.
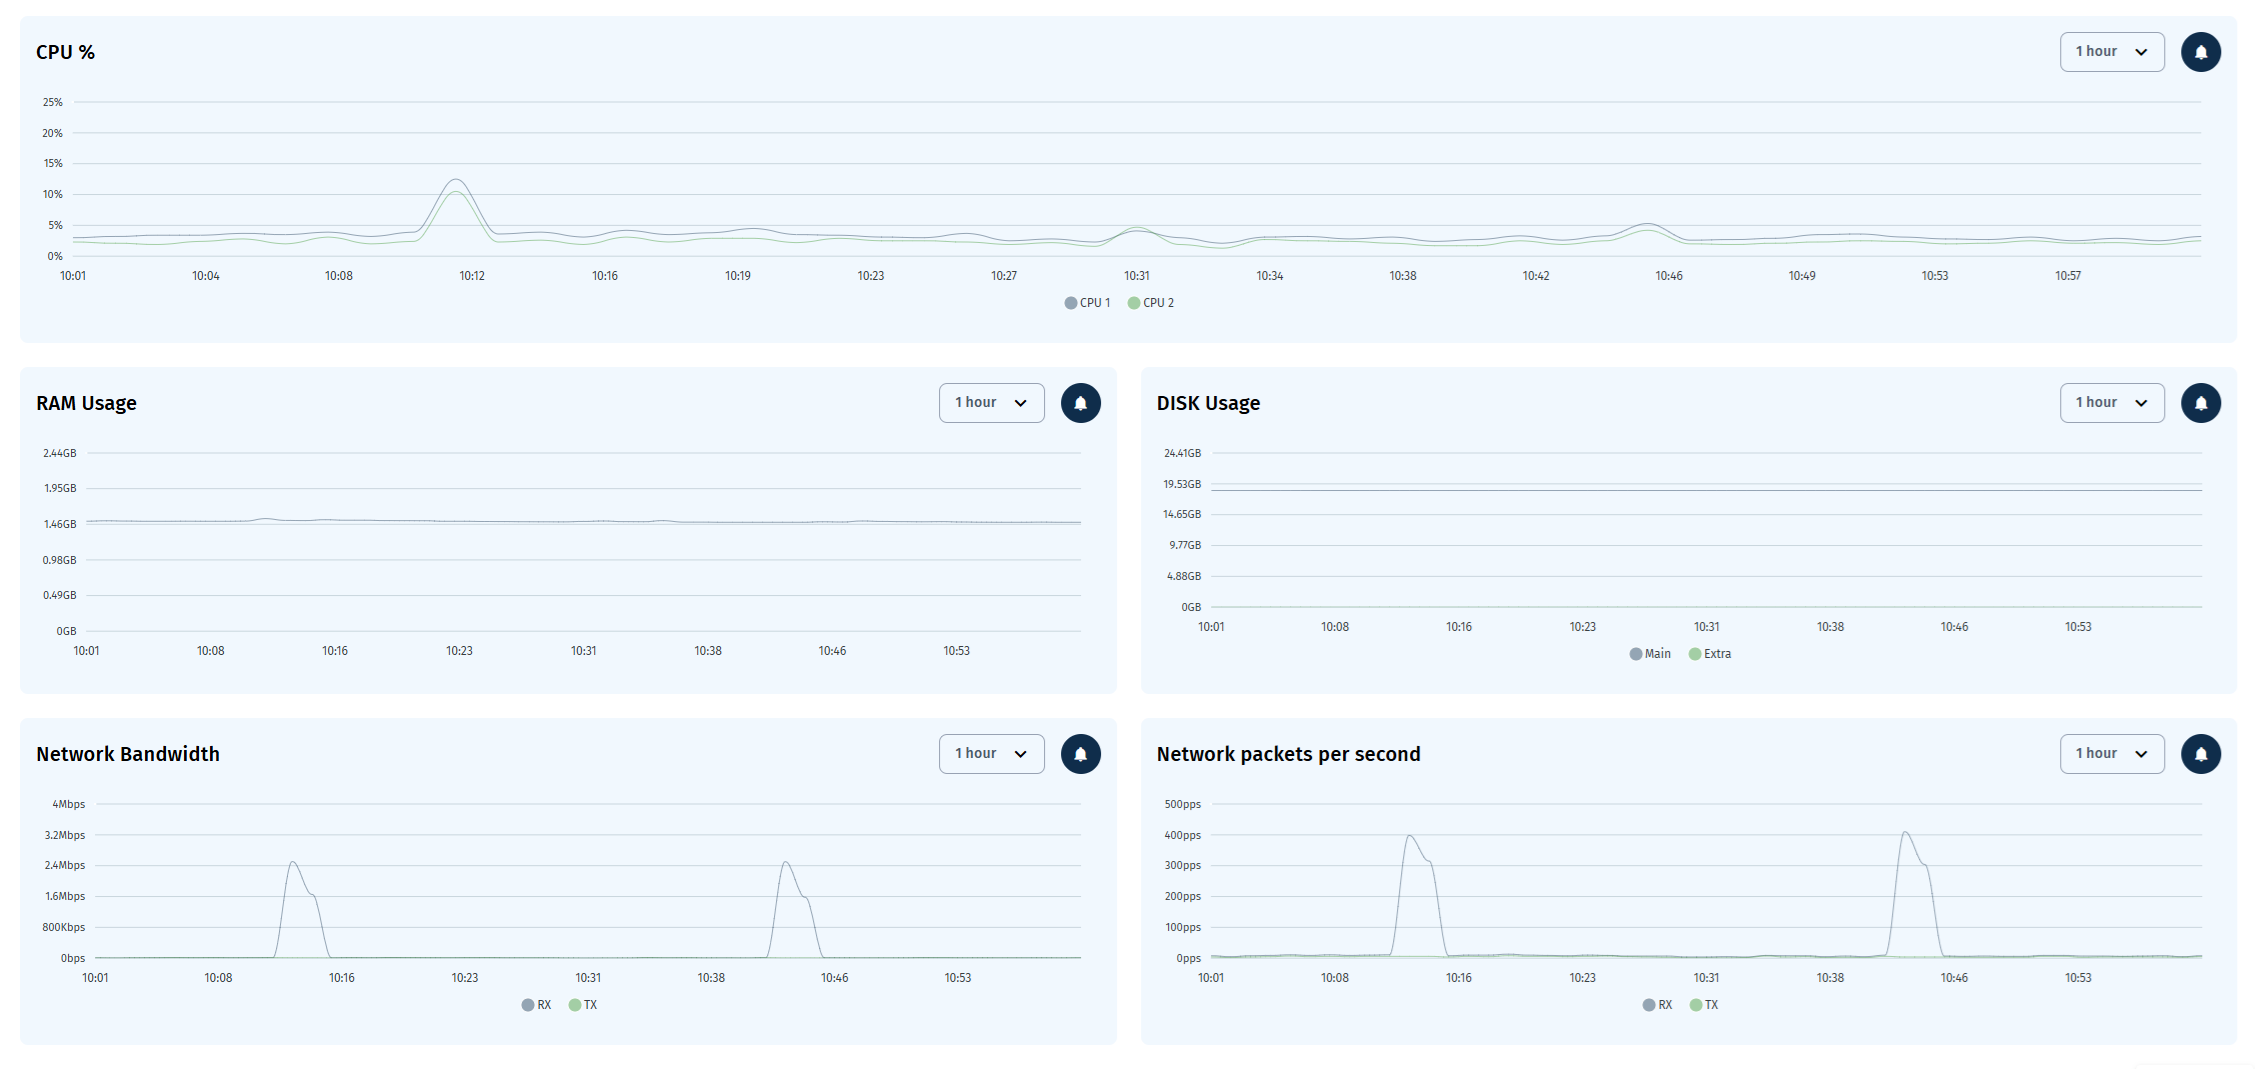
Please note: Monitoring metrics are available for periods from 1 hour up to 30 days.
What channels can receive alert messages?#
Alerts can be delivered by email, SMS, Slack, or as a notification to all Workspace members.
How to manage my alerts (edit, delete)#
To manage your alerts, follow the steps below:
- In the Dashboard, open the Monitoring section.
- Select the previously created alert and click the menu (three dots).
- Click Edit to change the alert settings, or Delete to remove it.
Next steps#
- Add extra disk storage if disk alerts fire frequently
- Upgrade your VM plan if CPU or RAM is consistently high
- Review VM activity history
Open in myDelska Platform#
Open Monitoring in myDelska to create and manage alerts for the whole Workspace, or open a VM's Monitoring tab directly.